White Paper: Semaglutide and Weight Management
Executive summary
- Among 1,482 adults with a body mass index (BMI) ≥27 kg/m2 who initiated injectable semaglutide between March 2018 and November 2023, the median percentage BMI reduction after 3-6 months was 4.5% (interquartile range: 1.8% to 8.3%).
- After 6 months of semaglutide use, 51% of patients achieved a BMI reduction ≥5%, and 22% achieved a BMI reduction ≥10%. After 12 months of use, 58% of patients achieved a BMI reduction ≥5%, 35% achieved a BMI reduction ≥10%, and 17% achieved a BMI reduction ≥15%.
- Greater BMI reductions were observed among females and among patients who reached higher semaglutide doses (≥1.7 mg), whereas type 2 diabetes was associated with a lower percentage BMI reduction.
Background
Semaglutide is a glucagon-like peptide-1 (GLP-1) receptor agonist, mimicking the function of the naturally occurring GLP-1 hormone that is secreted in the gut following food intake. It stimulates the body to produce more insulin, which in turn decreases blood glucose levels, and reduces the risk of heart attack, stroke, or death. Additionally, semaglutide interacts with specific areas in the brain that suppress appetite and trigger feelings of satiety, contributing to its use in weight management. It was first approved for the treatment of type 2 diabetes as a once-weekly injection (0.5 mg, 1 mg, or 2 mg) in 2017 (Ozempic) and as a once-daily oral pill (7 mg or 14 mg) in 2019 (Rybelsus). For individuals who are unable to achieve glycemic control with a lower dose, it may be necessary to switch to a higher dose. More recently, semaglutide was approved in 2021 as a once-weekly 1.7-mg or 2.4-mg injection for chronic weight management (Wegovy). Individuals who are unable to tolerate 2.4 mg may use 1.7 mg instead.
Here, we leverage electronic health record (EHR) data collected from adults initiating injectable semaglutide to characterize weight change, as recorded during health care visits, over the course of up to 12 months.
Data sources
We performed a secondary analysis of EHR data obtained from three health systems participating in either the Helix Research Network and/or the Healthy Nevada Project. Data were collected from a participant’s EHR and transformed into the Observational Medical Outcomes Partnership (OMOP) Common Data Model v5.4. Participants provided written informed consent prior to participation under Salus IRB Protocol #21143 or the University of Nevada, Reno IRB #7701703417. Among 4,053 adult patients with ≥1 semaglutide prescription between March 2018 and November 2023, 1,482 (37%) were included in the current analysis (see Data Processing for more details).
Semaglutide dose
Among 715 patients with no type 2 diabetes diagnosis, 353 (49%) had a high documented semaglutide dose of either 1.7 mg, 2.0 mg, or 2.4 mg, compared with only 116 (15%) of 767 patients with type 2 diabetes (Figure 1). This difference by type 2 diabetes status reflects the fact that approved doses differ for chronic weight management versus treatment of type 2 diabetes, where doses for type 2 diabetes can typically start off lower and only increase if deemed necessary.
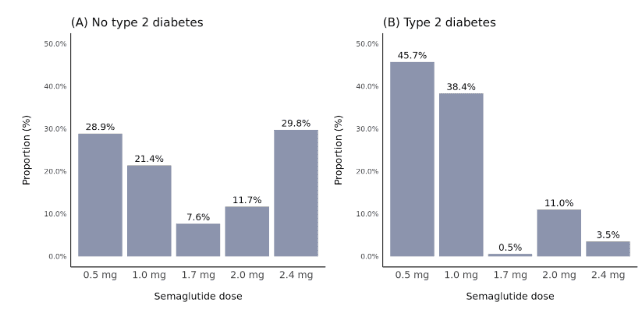
Figure 1. Distribution of semaglutide dose stratified by type 2 diabetes status. Dose was defined as the highest dose reached within 12 months after semaglutide initiation.
Percentage BMI change over 12 months
The overall median percentage reduction in BMI was 2.5% after 0-3 months, 4.5% after 3-6 months, 6.4% after 6-9 months, and 6.3% after 9-12 months (Figure 2). However, there was large variability across patients and a greater range in BMI change as time since semaglutide initiation progressed. After 9-12 months, the top quartile of patients achieved a BMI reduction of at least 11.2%, while the bottom quartile had less than 1.9% BMI reduction, or even experienced weight gain.
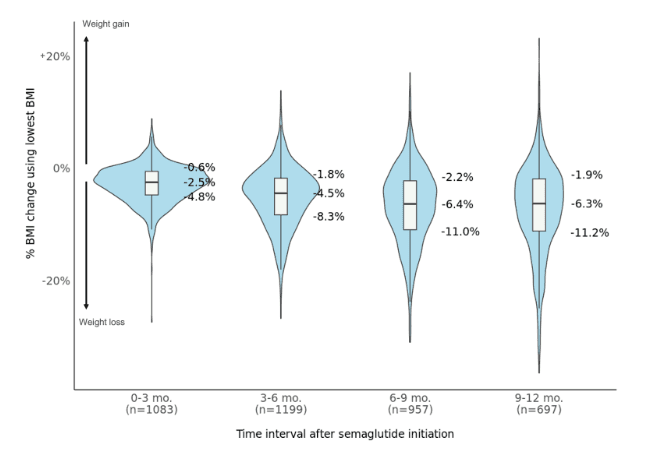
Figure 2. Percentage BMI changes during different time intervals following semaglutide initiation. Patients with at least one BMI measurement during each interval were included. When more than one measurement was present, the lowest value was used, representing the maximum weight loss achieved. Box and violin plots show the median and 25th/75th percentiles.
The proportions of patients with a ≥5%, ≥10%, ≥15%, or ≥20% reduction in BMI increased with longer durations of semaglutide use (Figure 3). Many patients achieved a ≥5% BMI reduction within 3 or 6 months (32% and 51% of patients, respectively). The proportion of patients with a ≥10% reduction by 6 months was 22%, compared to 35% by 12 months. A subset of patients achieved ≥15% or ≥20% BMI reductions by 12 months (17% and 9% of patients, respectively).
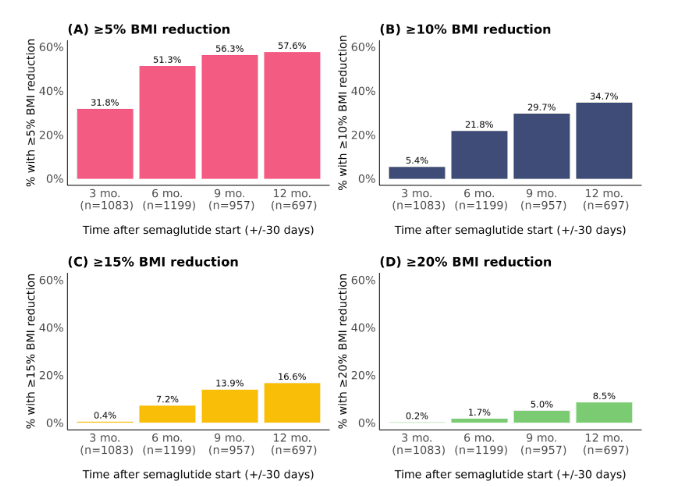
Figure 3. Proportions with a percentage BMI reduction (A) ≥5%, (B) ≥10%, (C) ≥15%, and (D) ≥20% at different time points following semaglutide initiation. Patients with at least one BMI measure at each time point (+/-30 days) were included. When more than one measure was present within +/-30 days, the median value was used.
Trajectories of BMI change over 12 months
Regarding trajectories of percentage BMI change over 12 months, higher semaglutide dose (≥1.7 mg vs 0.5 or 1.0 mg) and female sex were associated with greater percentage BMI reductions, whereas type 2 diabetes was associated with a lower percentage BMI reduction (Figure 4). There was no notable difference by baseline BMI category.
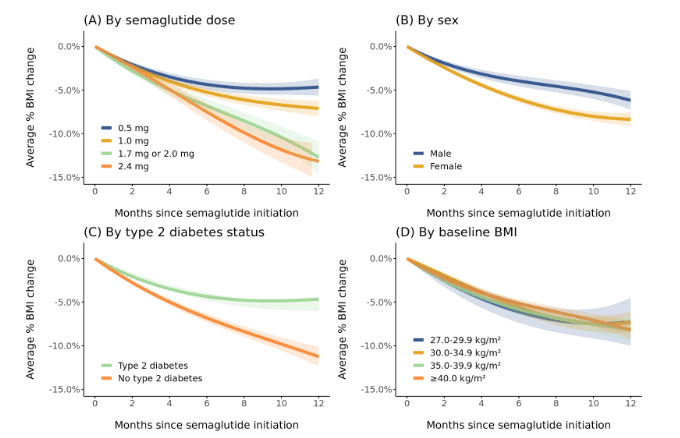
Figure 4. Trajectories of percentage BMI change during the 12 months after semaglutide initiation stratified by (A) semaglutide dose, (B) sex, (C) type 2 diabetes status, and (D) baseline BMI. Patients were included if they had ≥2 follow-up BMI measurements spanning ≥2 months during the first 12 months of semaglutide use (1,345 patients contributing 7,751 BMI measurements). Dose was defined as the highest semaglutide dose reached during the period. Trajectories were modeled using linear mixed effects models with linear, quadratic, and cubic terms for time. Models were intercept-free because the outcome was percentage change. Random effects for the linear and quadratic slopes for individual patients were included. Bands depict 95% confidence intervals.
To evaluate whether the difference in response between females and males was attributed to sex differences in semaglutide dose or in type 2 diabetes status, we further examined BMI trajectories only among patients without type 2 diabetes who reached a semaglutide dose ≥1.7 mg. Consistent with earlier results, a higher rate of percentage BMI change was observed among females compared to males (Figure 5).
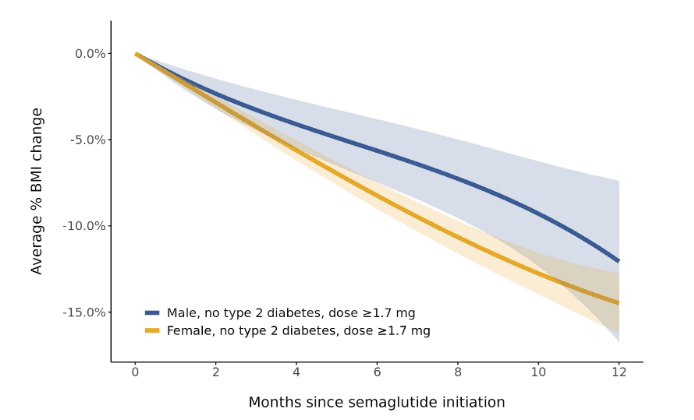
Figure 5. Sex-specific trajectories of percentage BMI change during the 12 months after semaglutide initiation among patients with dose ≥1.7 mg and without type 2 diabetes. Patients were included if they had ≥2 follow-up BMI measurements spanning ≥2 months during the first 12 months of semaglutide use (328 patients contributing 1,686 BMI measurements). Dose was defined as the highest semaglutide dose reached during the period. Trajectories were modeled using linear mixed effects models with linear, quadratic, and cubic terms for time. Models were intercept-free because the outcome was percentage change. Random effects for the linear and quadratic slopes for individual patients were included. Bands depict 95% confidence intervals.
In a multivariable mixed effects model that defined semaglutide dose as a time-dependent covariate, we examined interaction terms with time to determine whether rates of percentage BMI change varied depending on patient characteristics or dose. After adjusting for calendar time, health system, age, ancestry, and baseline weight, female sex remained significantly associated with higher rates of BMI loss (p=0.021). In addition, semaglutide doses of 1.7 mg or 2.0 mg (p=0.001) and 2.4 mg (p<0.001), compared to 0.5 mg, were also associated with a greater rate of BMI reduction. On the other hand, patients with type 2 diabetes had slower rates of BMI loss (p<0.001) (data not shown).
Other studies have similarly found that males and individuals with type 2 diabetes experience less weight loss during semaglutide use (including studies from the Mayo Clinic Health System and a network of 10 medical centers). Speculated biological plausibility for the sex difference include differences in body weight at baseline, which might lead to greater average drug exposures among women compared to men, and the potential interaction of semaglutide with sex hormones that play a role in appetite regulation (e.g., estrogen).
Reasons for the difference by type 2 diabetes status may be related to more general reasons why it is often more difficult for individuals with type 2 diabetes to lose weight. Concomitant antidiabetic medications (e.g., insulin) can lead to weight gain, diabetes-associated metabolic changes can make weight loss more difficult, and people with diabetes may on average have a lower energy expenditure. On the whole, reasons for semaglutide differences are not fully understood and warrant further research, especially studies of real-world weight loss with semaglutide that include people without type 2 diabetes, like this one. Compared to previous studies, the findings presented in this report offer a more nuanced understanding of non-linear weight changes over 12 months, stratified by key patient characteristics.
Caveats
Intervals of semaglutide use were defined using prescription data. It is possible that prescriptions were not filled or that patients were not compliant with prescribed dosing frequencies. Duration of use following a prescription was also unknown. We assumed that patients had ongoing semaglutide use between consecutive prescriptions (irrespective of the duration between prescriptions) and that semaglutide use was ongoing for 3 months after the last available prescription. Measurement error of weight is also possible when relying on measurements documented in EHRs as a part of clinical practice.
Data Processing
The analytic cohort was selected from 4,053 adult patients with ≥1 semaglutide prescription. Of those, 1,482 (37%) who initiated injectable semaglutide between March 2018 and November 2023 met all inclusion criteria:
- At least 2 semaglutide prescriptions ≥3 months apart (to be reasonably confident of ongoing use)
- No other GLP-1 receptor agonist within 6 months before semaglutide initiation or within the first 3 months of semaglutide use
- No prescription for oral semaglutide (Rybelsus)
- Baseline BMI ≥27 kg/m2, based on the most recent BMI measurement available within 6 months before (or on) the semaglutide start date
- At least 1 follow-up BMI measurement available 3-12 months after the semaglutide start date
Among all weight measurements within up to 12 months after semaglutide initiation, BMI was calculated as weight in kilograms divided by the square of height in meters. Each patient’s median height among all adult height measurements was used. For each follow-up BMI measurement, percentage BMI change was calculated as follow-up BMI minus baseline BMI, divided by baseline BMI. Patients’ last date of semaglutide use was estimated as 3 months after their last prescription, and only BMI measurements prior to that date were considered. Similarly, if patients were newly prescribed a different GLP-1 receptor agonist during semaglutide follow-up, only earlier BMI measurements were used. A median of 5 BMI measurements were contributed per person (interquartile range: 3-7).
Prepared by Matthew Levy, PhD; Natalie Telis, PhD; and Elizabeth Cirulli, PhD; Helix, California.
Acknowledgements: This research was conducted using data from the Helix Research Network under an approved application [EDA-5]. This research was possible because of the participants who have contributed to the Network through participating institutions: myGenetics, HealthPartners, Minnesota, Douglas Olson, MD; and Gene Health Project, WellSpan Health, Pennsylvania, C. Anwar Chahal, MD, PhD. This research was also conducted using data from the Healthy Nevada Project (Renown Health, Nevada, Joseph Grzymski, PhD).
© Helix, Inc. 2024. All rights reserved.
Helix and the Helix logo are registered trademarks of Helix, Inc.